The Marketing Metrics Cheat Sheet: What to Measure at Every Stage of the Customer Journey
A stage-by-stage marketing metrics cheat sheet- from awareness to retention - so you can read performance as a narrative, spot breakdowns, and fix fast with GenAI.

We have spent the last ten articles building frameworks for how to think about marketing strategy: the customer as Hero, the brand as Guide, the narrative arc, the visual architecture, the content system, and the customer journey.
But frameworks without measurement are just philosophy.
The right question is never just "Did we publish something?" or even "Did people see it?" The right question is: Did the communication move the customer forward - and how do we know?
That distinction matters more than most marketers realise. Because the same metric can mean entirely different things depending on where in the journey it appears. A high Bounce Rate on a social post is expected. A high Bounce Rate on a conversion landing page is a strategic failure. Context is everything. Stage determines meaning.
This cheat sheet organises the essential marketing metrics across four customer journey stages. It is not a glossary. It is a field guide for interpretation – built to help you read your data as a story, identify exactly where the journey breaks down, and make decisions grounded in both evidence and strategy.
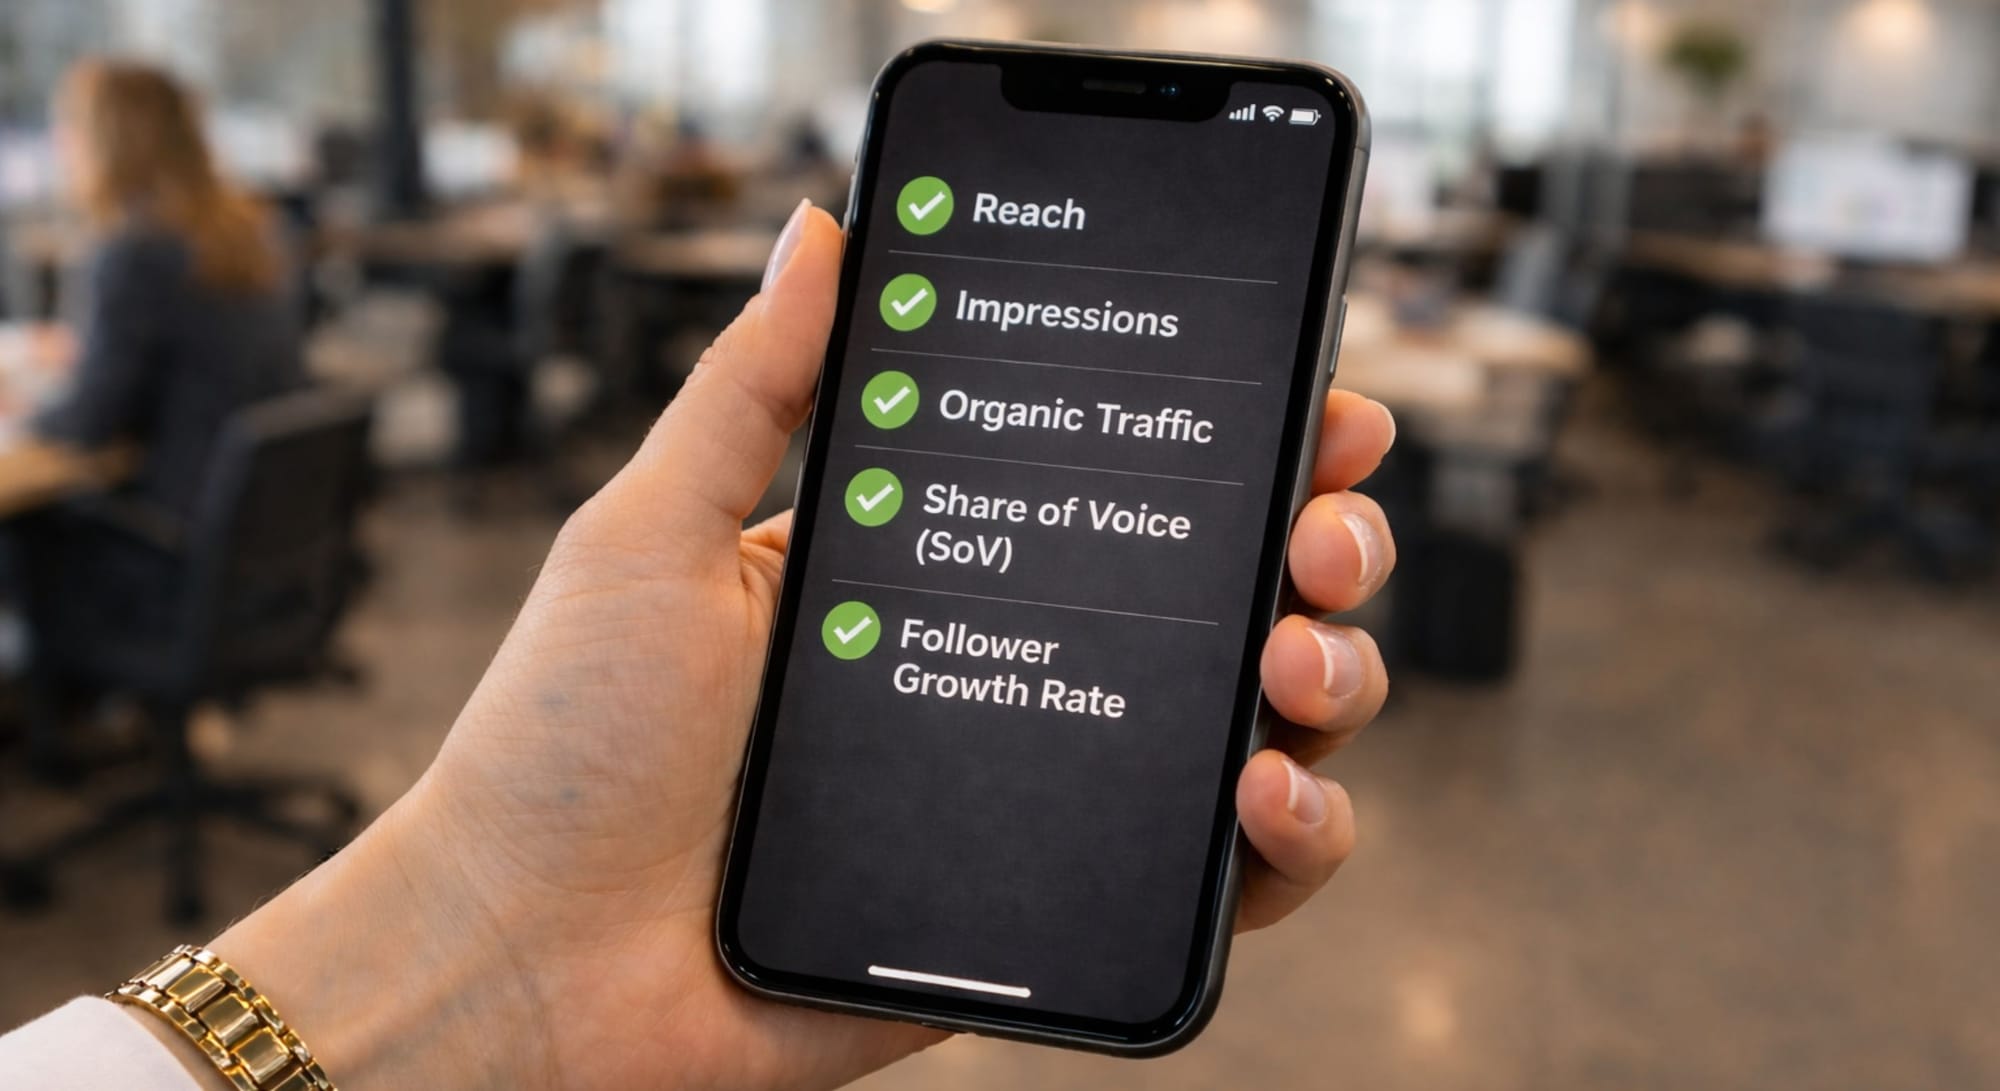
Stage 1 Awareness
The customer does not yet know you exist, or has only just encountered you. The goal is not conversion, it is recognition, relevance, and the first moment of genuine attention.
The metrics here tell you whether your signal is reaching the right people and whether it is strong enough to register in a crowded environment. Volume matters, but quality of reach matters more. Reaching a million people who will never become customers is a waste of budget and signal.
- Reach: The number of unique people who saw your content across any channel. This is your broadest visibility metric. Growing Reach signals that your distribution strategy is working.
- Impressions: The total number of times your content was displayed, including repeat views. High Impressions relative to Reach means frequency is high - useful for brand recall, but not a substitute for broad discovery.
- Organic Traffic: Visitors arriving via search engines without paid promotion. This is one of the most valuable Awareness metrics because it is earned – your content has enough authority and relevance to surface unprompted.
- Share of Voice (SoV): The percentage of total market conversations mentioning your brand compared to competitors. A positioning metric – are you part of the relevant conversation or absent from it?
- Follower Growth Rate: The speed at which your audience is expanding. Consistent growth signals your content is finding new potential customers and giving them enough reason to stay connected.
Strategic lens: Strong Awareness metrics with weak downstream performance usually signal a targeting problem – you are reaching people, but not the right people. Before increasing Awareness spend, validate that your audience definition is precise enough to make the reach meaningful.
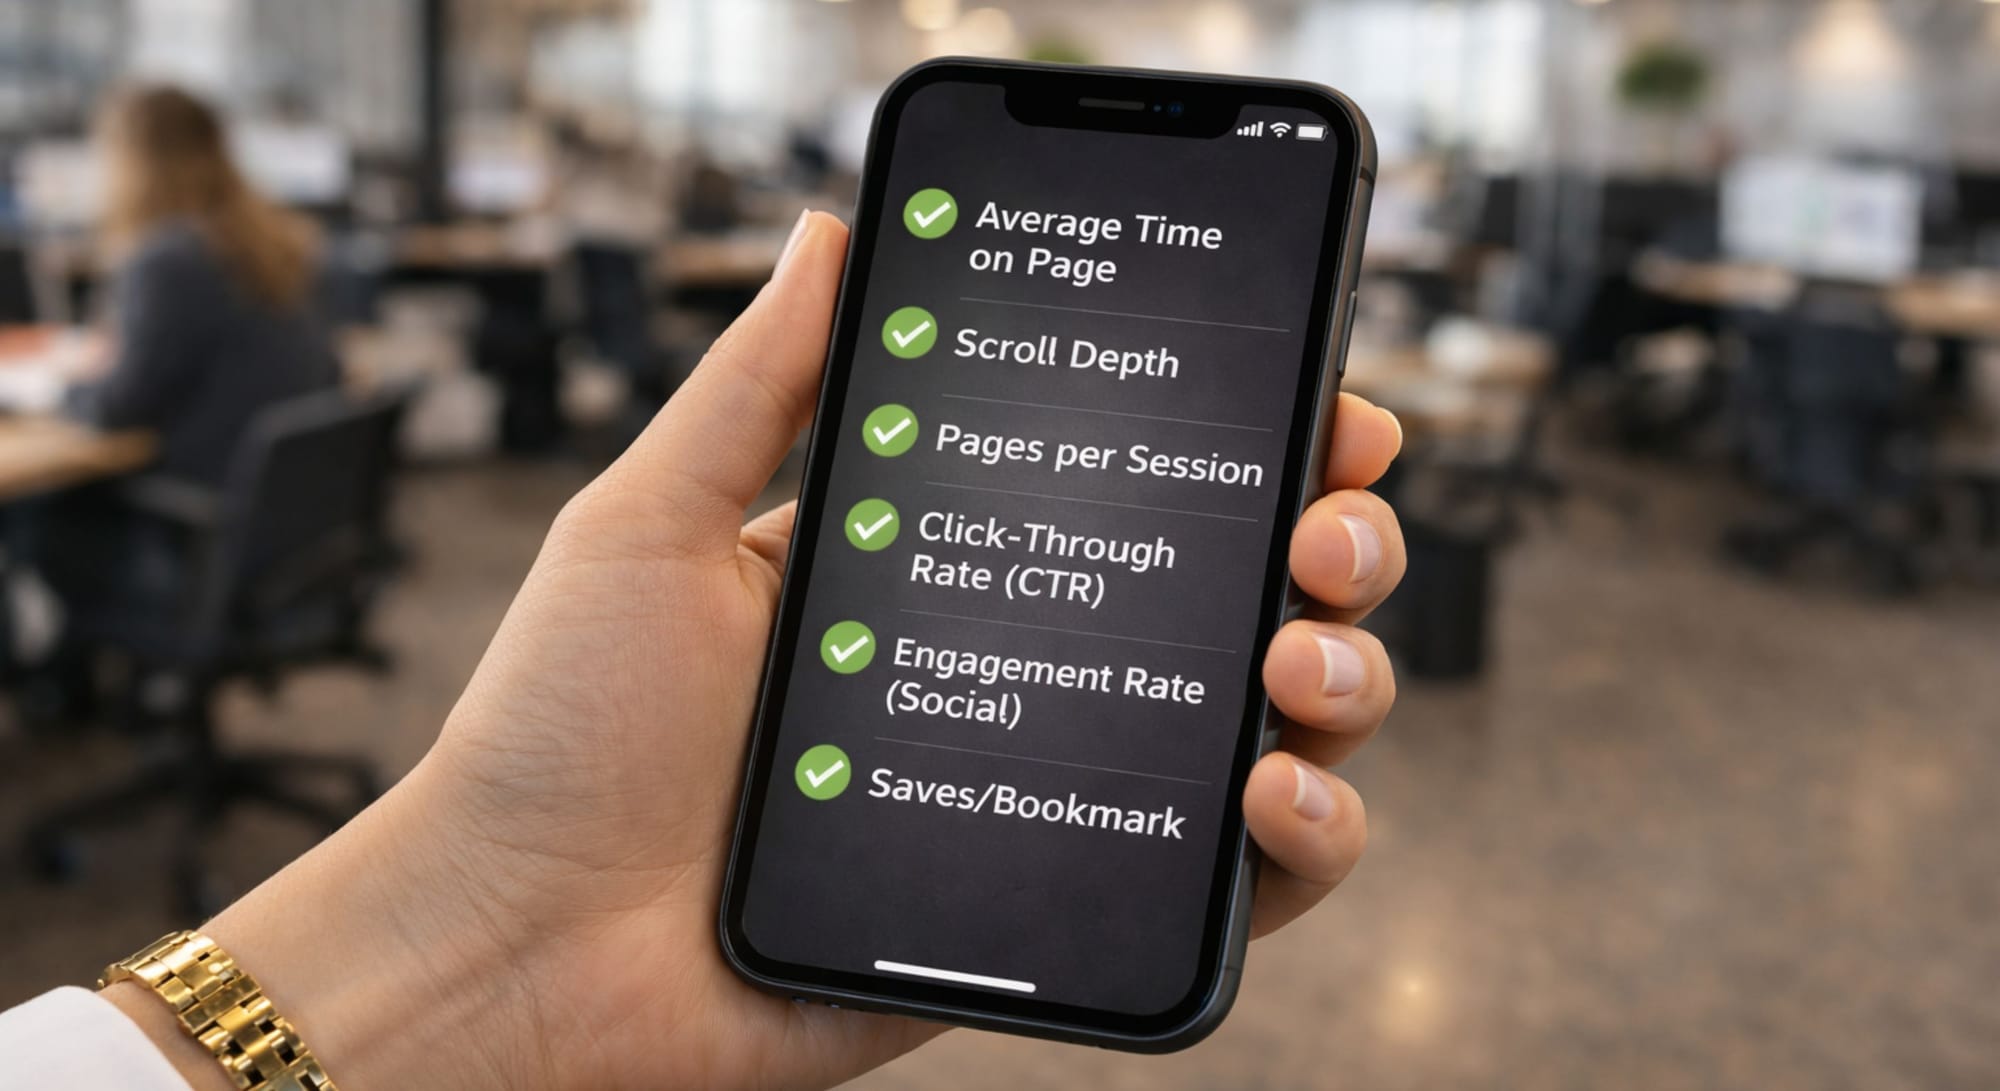
Stage 2 Consideration
The customer is now aware of you. They are evaluating – reading, exploring, comparing, and deciding whether you understand their problem well enough to be worth their continued attention. This is the stage where trust is built or lost.
The metrics here tell you whether your content is holding attention, whether your narrative is persuasive enough to move readers forward, and whether your site architecture supports deeper exploration. Consideration is the most nuanced stage to measure because engagement signals are easy to mistake for conversion readiness.
- Average Time on Page: How long users stay with your content. High time on page means your narrative has enough substance and relevance to hold attention beyond the first few seconds.
- Scroll Depth: Tracks exactly how far down a page readers engage. This tells you precisely where your narrative loses momentum, and where the content structure needs to be strengthened.
- Pages per Session: The average number of pages a user views in a single visit. Higher numbers indicate successful navigation, the visitor is exploring the ecosystem, not just landing and leaving.
- Click-Through Rate (CTR): At the Consideration stage, CTR measures how well your content is guiding the reader toward the next step in the journey, not just whether they arrived.
- Engagement Rate (Social): Total interactions divided by total reach or followers. At this stage, engagement signals that your content is resonating with people who are actively processing your message.
- Saves/Bookmarks: The highest-intent Consideration metric. When someone saves your content, they are signalling it has enough value to return to a stronger intent signal than a like or a share.
Strategic lens: High Time on Page combined with low CTR often means the content is interesting but not directive, and the reader is engaged but does not know what to do next. The fix is usually structural: clearer CTA placement, stronger transitional copy, or a more explicit bridge between content value and the next step.
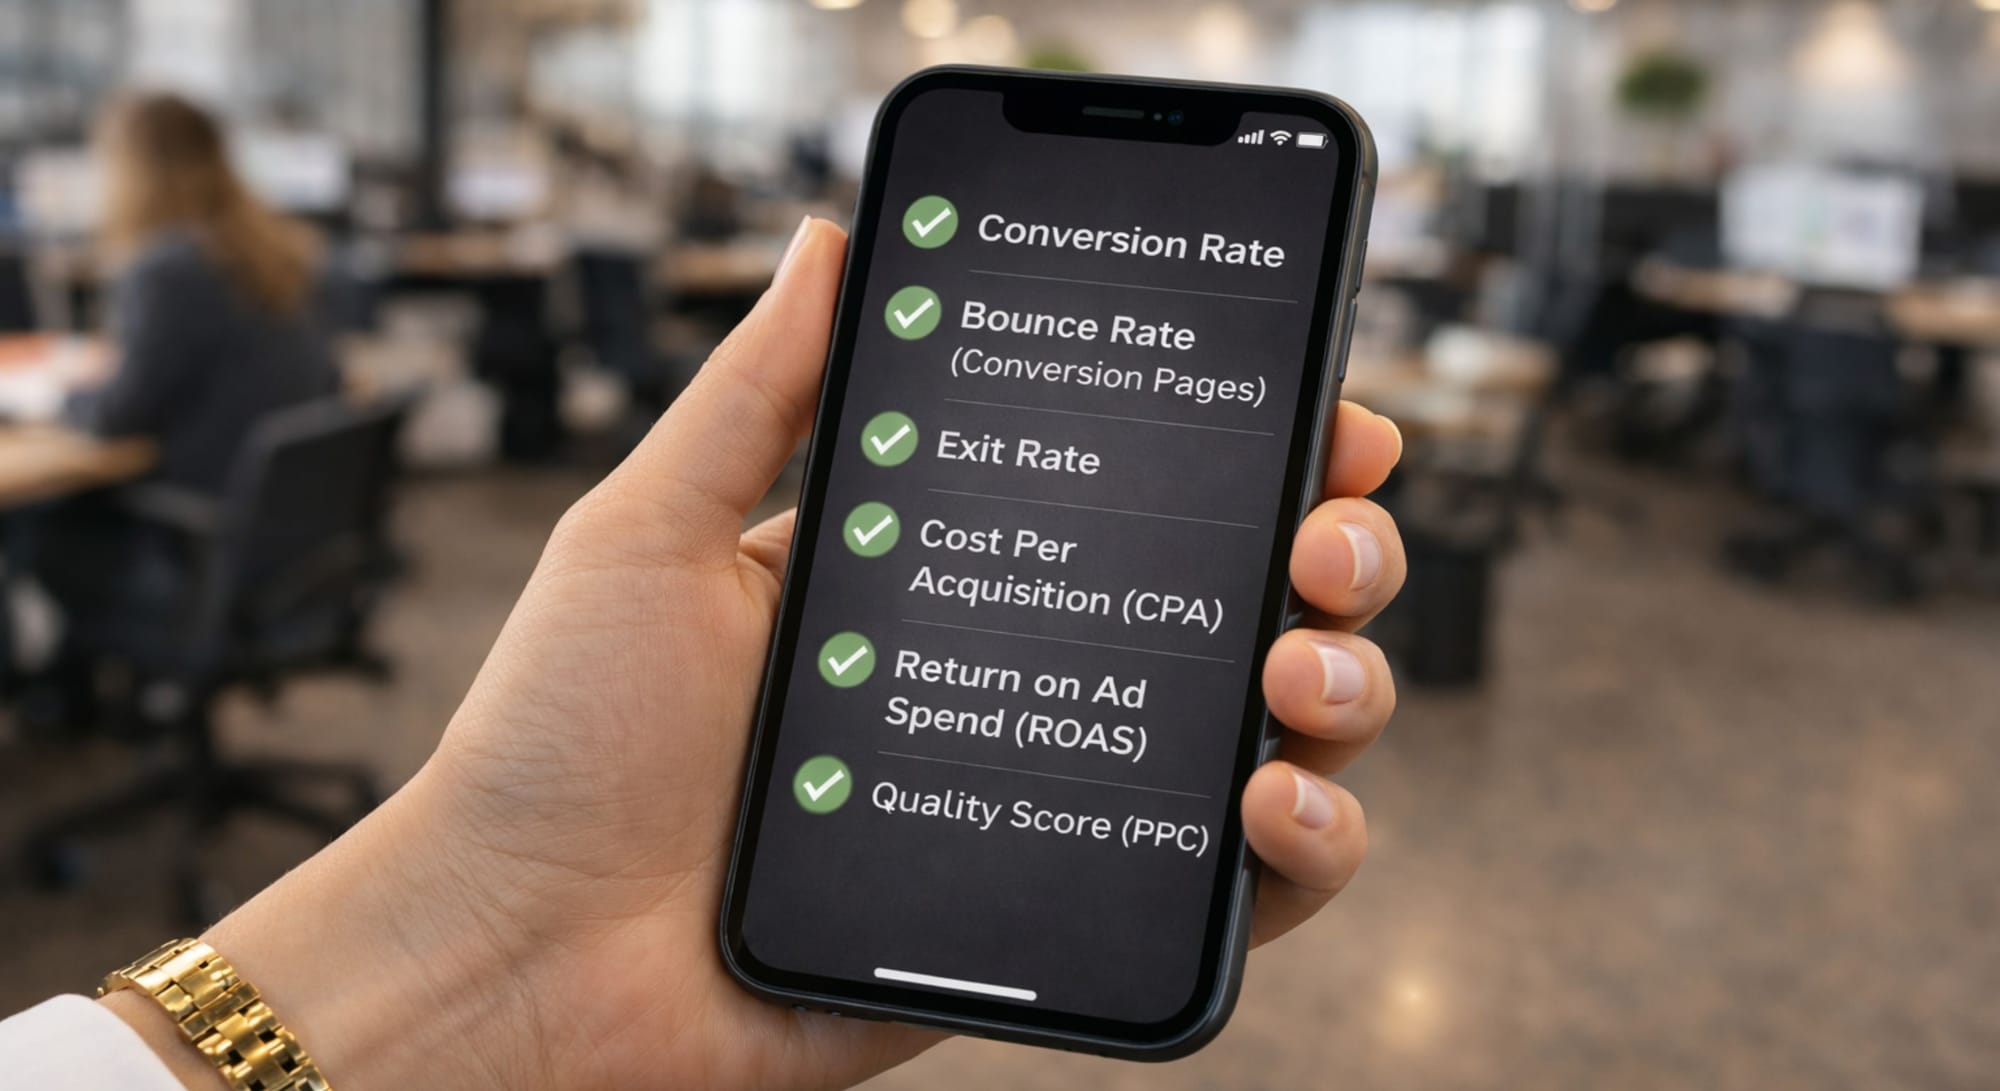
Stage 3 Conversion
The customer is ready to act. The goal is to remove friction, reinforce the decision, and make the path to commitment as clear and confident as possible. This is where all upstream marketing either pays off or falls apart.
The metrics here measure efficiency – how much it costs to move a customer from intent to action, how well your pages and ads are performing relative to their potential, and whether your conversion architecture is aligned with your audience's actual decision-making process.
- Conversion Rate: The percentage of visitors who completed a specific goal – purchasing, signing up, requesting a demo. This is the ultimate measure of whether copy, design, and offer are working together.
- Bounce Rate (Conversion Pages): A high Bounce Rate at this stage means either the page failed to deliver on the promise that brought the visitor there, or the offer itself was not compelling enough.
- Exit Rate: The percentage of visitors who leave from a specific page within a multi-step journey. Unlike Bounce Rate, Exit Rate identifies exactly which step in a conversion funnel is breaking down.
- Cost Per Acquisition (CPA): Total campaign cost divided by the number of conversions. This is how much it costs to acquire one customer – the metric that connects marketing efficiency to business outcome.
- Return on Ad Spend (ROAS): Revenue generated for every dollar spent on advertising. The most direct measure of paid campaign efficiency - and the number that connects your work to the P&L.
- Quality Score (PPC): A platform measure of the relevance and alignment of your ad copy, keywords, and landing page. A high Quality Score lowers your Cost Per Click - more coherent messaging is literally cheaper.
Strategic lens: If Conversion Rate is low despite strong upstream metrics: good Reach, strong Engagement, healthy Time on Page - the problem is almost always in the final 20% of the journey: the CTA copy, the page layout, the offer framing, or the trust signals on the conversion page. Fix the last step before rebuilding the whole funnel.
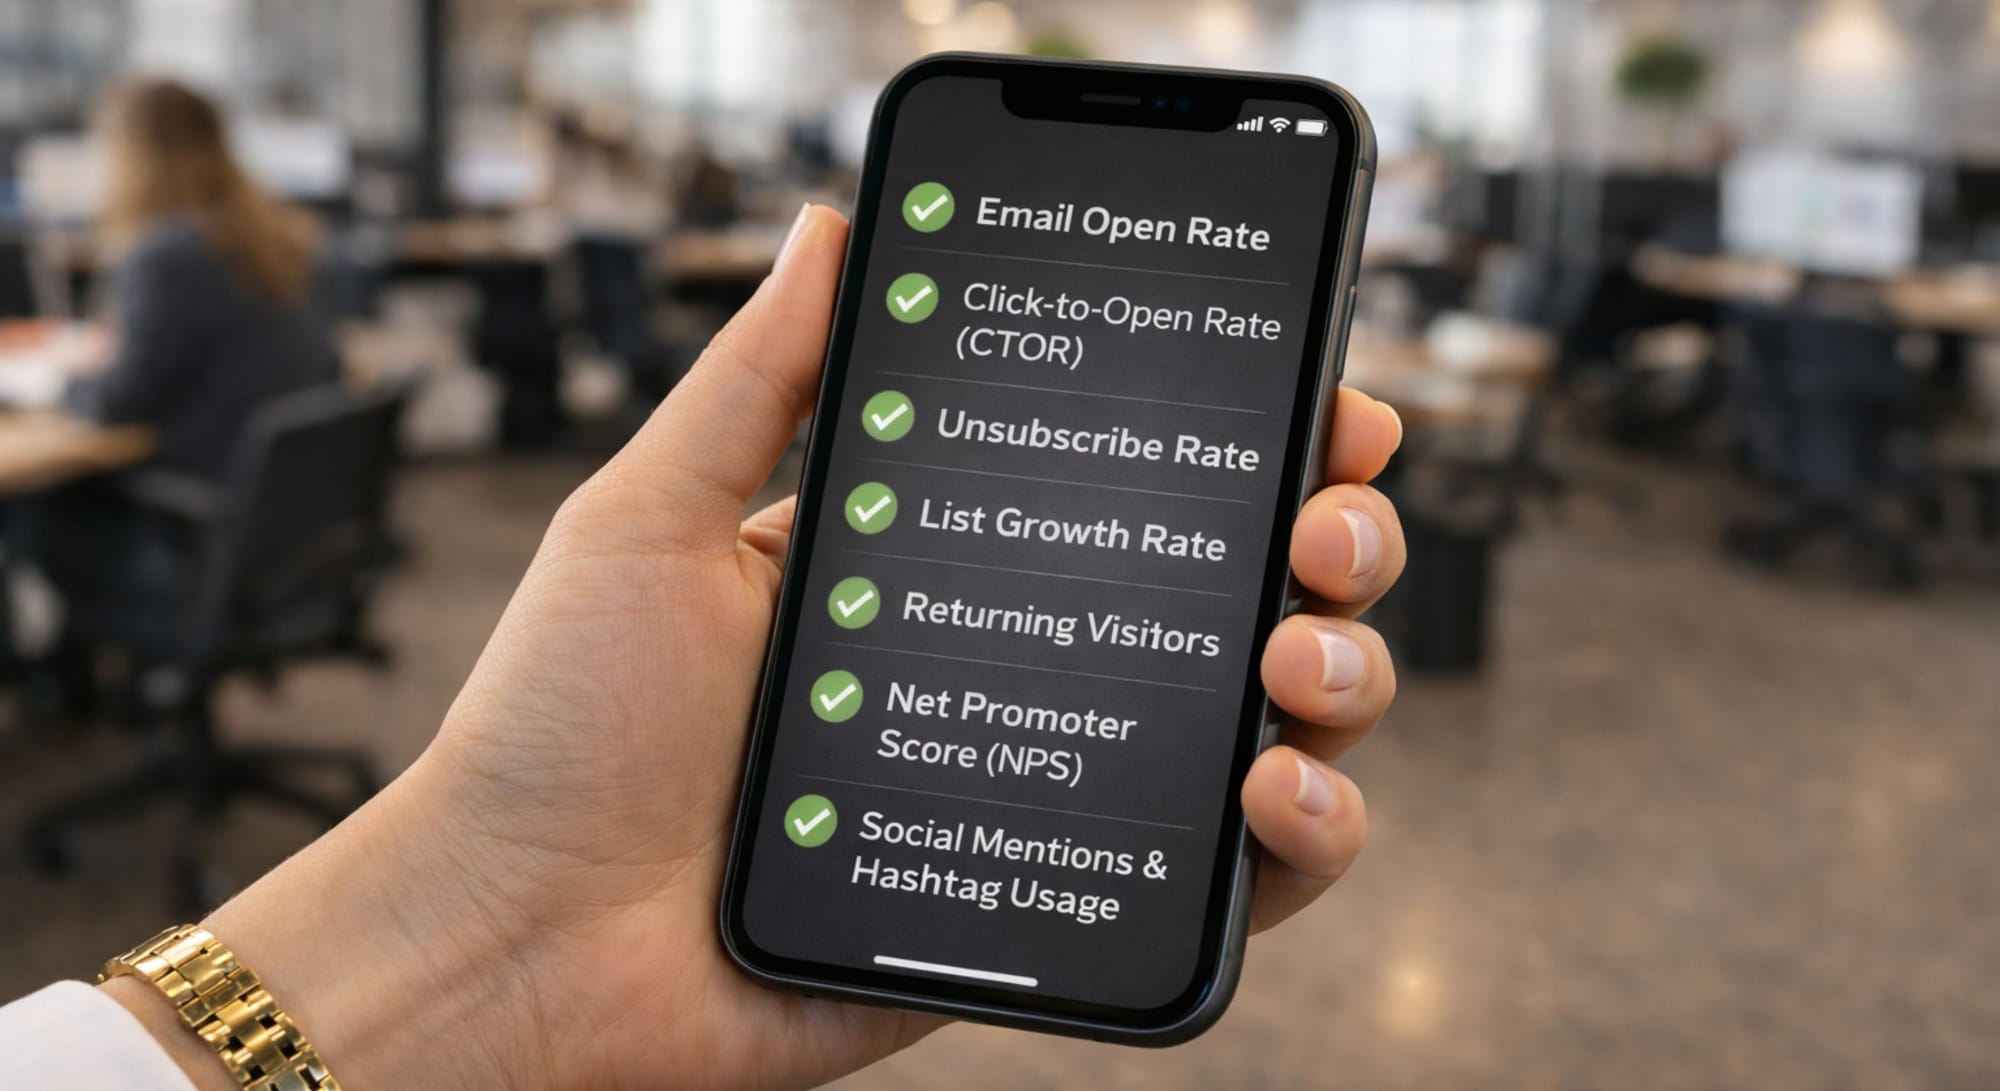
Stage 4 Retention & Advocacy
The customer has converted. The journey does not end here; it deepens. The goal is to sustain trust, deliver continued value, and create the conditions for loyalty, repeat engagement, and active recommendation.
These metrics are often the most underprioritised in marketing dashboards because most attention goes to acquisition. But a retained customer costs a fraction of what an acquired one does - and an advocate is the most credible voice in your marketing ecosystem.
- Email Open Rate: At the Retention stage, this is a trust metric – it measures whether your audience still considers your communication worth their attention over time.
- Click-to-Open Rate (CTOR): Of those who opened, how many clicked a link. The most honest measure of whether your email content is genuinely useful to your existing audience.
- Unsubscribe Rate: A spike signals the content no longer serves the audience's needs, or the frequency has exceeded the trust you have built. A small but steady rate is normal – a sudden jump is a warning.
- List Growth Rate: Net subscriber growth – new subscribers minus unsubscribes and bounces. Healthy growth means your content strategy is attracting new people faster than it is losing existing ones.
- Returning Visitors: The percentage of website visitors who have been there before. A strong returning visitor rate signals that your content has enough ongoing value to bring people back.
- Net Promoter Score (NPS): A direct measure of whether your customers would recommend you to someone they trust. This is the bridge between satisfaction and advocacy.
- Social Mentions & Hashtag Usage: When customers share their experience unprompted, they become part of your marketing strategy. Recommendation carries more weight than any campaign you could run.
Strategic lens: A high NPS combined with low Social Mentions often means your customers are satisfied but not inspired to share. This is a content and community challenge - give your best customers a reason and a context to talk about you. The most effective advocacy is not accidental; it is designed.
GenAi Exercise: From Raw Metrics to Narrative Diagnosis
This is where measurement becomes genuinely strategic. Most marketers use GenAI to produce content. This exercise runs the process in reverse: you give GenAI your performance data and ask it to reconstruct the customer story hidden inside the numbers – what actually happened at each stage of the journey, seen through metrics.
Step 1 Gather your data
Collect real metrics from a recent campaign across at least 3 journey stages. For example: social reach and engagement rate (Awareness), landing page time on page and CTR (Consideration), conversion rate and CPA (Conversion), email open rate and CTOR (Retention). Raw numbers work better than percentages alone - include both wherever possible.
Step 2 Run this prompt:
You are a Senior Marketing Strategist who reads performance data as narrative.
I am giving you the metrics from a recent campaign, organised by customer journey stage.
Your task is NOT to define what each metric means.
Your task is to reconstruct the customer story hidden inside these numbers – what the audience experienced at each stage, where they engaged, and where they stopped.
Campaign: [Name or type]
Target audience: [Brief persona description]
Metrics by stage:
AWARENESS: [e.g., Reach: 45,000 / Impressions: 120,000 / Organic Traffic: 1,200]
CONSIDERATION: [e.g., Avg. Time on Page: 1m 40s / Scroll Depth: 45% / CTR: 2.1%]
CONVERSION: [e.g., Conversion Rate: 0.8% / Bounce Rate on landing page: 72% / CPA: €38]
RETENTION: [e.g., Open Rate: 34% / CTOR: 8% / Unsubscribe Rate: 0.9%]
Deliver three outputs:
1. THE STORY (3 paragraphs - one per the most critical stages):
Narrate what the customer experienced – what captured their attention,
what created doubt, and what caused them to abandon or convert.
2. THE DIAGNOSIS (1 paragraph): Identify the single biggest breakdown point. Name the exact stage, the exact metric that signals it, and why it matters more than the others.
3. THE REWRITE (3 bullet points): Suggest one specific, actionable change
per the three most critical touchpoints – in copy, visual hierarchy,
CTA placement, offer framing, or channel sequence.
Rules:
- Every claim must reference a specific metric from the data provided.
- No generic advice. No best practices that could apply to any campaign.
- The customer is always the protagonist. Frame every recommendation from their perspective, not the brand's.
- If a stage shows strong metrics, say so explicitly - not every stage needs fixing, and false diagnoses are worse than no diagnosis.
Step 3 Validate the output
Before acting on the AI's interpretation, pressure-test it across four dimensions:
Does the story match your intuition? GenAI reads numbers, not context. If it diagnoses strong Awareness but you know the targeting was broad and unqualified, the AI is missing information that only you have. Add it as a follow-up prompt.
Is the diagnosis specific enough? If the output says "the content was not engaging" without referencing a specific metric and stage, the answer is generic. Re-prompt: "Your diagnosis is too broad. Which specific metric at which specific stage is the primary signal, and what is the most likely single cause?".
Would the fix work for this specific audience? GenAI does not know your market context, cultural nuances, or competitive landscape. The recommendation may be technically sound but wrong for your situation. Apply your domain expertise before acting.
What did the AI miss? There is always something outside the data – a competitor campaign, an algorithm change, a sales follow-up that influenced conversion, an external event. Add that layer manually before drawing final conclusions.
The goal of this exercise is not to outsource your analysis to AI, but to use GenAI as a first-pass diagnostic engine – one that surfaces patterns quickly so that you can spend your strategic thinking on interpretation, not data sorting. Great marketing is not just what you say or how you say it, it is whether it moved the customer forward at every stage, and whether you can prove it.
Final Thought
Strategy without measurement is just storytelling. Measurement without strategy is just numbers. The combination – applied stage by stage, signal by signal – is what separates campaigns that build something from campaigns that simply run.
Are you reading your data as a narrative, or just staring at a dashboard?
Recommended Use Cases: