USE CASE: How to Use GenAI to Map the Customer Journey and Fix the Ignored Service Stage in a Car Dealership
A real-world GenAI marketing use case: how a multi-brand car dealership stopped marketing only to the sale and used GenAI to map the full customer journey; then build communications for the service and retention stage that quietly drives most of the profit.
A customer journey doesn’t end at the sale; for a car dealership, that’s where the profitable part begins. This is what mapping it with GenAI looks like in practice: how a dealership group found the stage it had been ignoring – service and ownership – and finally built the marketing for it.
The Context: Marketing that Stopped at the Handover
A multi-brand automotive dealership and service group, strong at the thing dealerships are always strong at: selling cars. The showroom, the offers, the test drives, the close – all well-resourced. But once the keys changed hands, the marketing went quiet. The service department ran on reminders the manufacturer sent and whatever customers remembered on their own. The most valuable relationship in the business began exactly where the marketing stopped.
The Challenge: the Profitable Stage Was the Ignored One
Every marketing reflex in a dealership points at the sale; it’s the visible, exciting, commission-shaped moment, so it gets the budget. But the recurring revenue lives downstream, in the service bay: maintenance, parts, repairs, the predictable work a car needs for years. Service and parts together throw off close to half of a dealership’s gross profit on a small fraction of its revenue. And the trend is going the wrong way – only about 54% of owners of newer cars returned to their selling dealer for service in 2025, down from 72% two years earlier, as customers drift to independent garages (Cox Automotive). Treating the journey as if it ended at the forecourt wasn’t just a missed nicety; it was walking away from the most profitable stage, right as it was eroding.
The sale is a turnstile, not a finish line: A car sale feels like the finish line; it’s actually the turnstile. The margin isn’t in the handover; it’s in the years of servicing, parts and the next car that follow it. Most dealerships throw everything at the moment of sale, then go quiet for exactly the period that pays the bills.
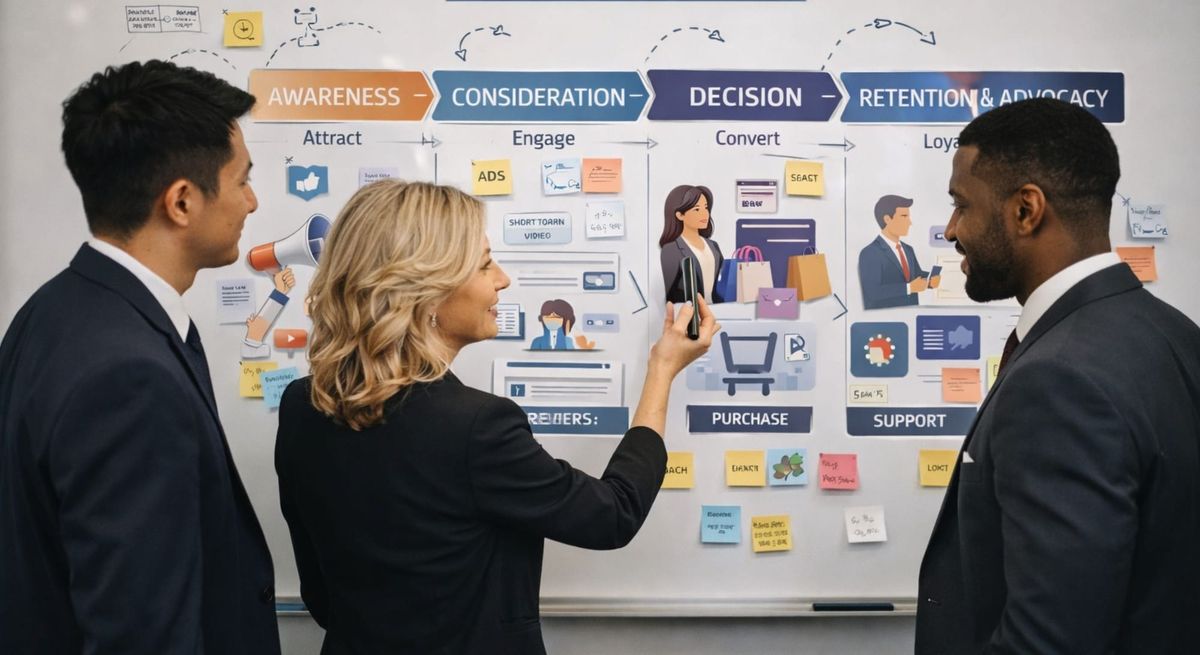
The GenAI Workflow: Map All 4 Stages, Then Build the One That’s Empty
Rather than guess, the group mapped its customer journey across all four stages from the customer’s point of view: what they need, feel and ask, from first interest through to years of ownership. GenAI was used to build that map and, crucially, to make the gap impossible to ignore: three stages crowded with marketing, the fourth – ownership and service – almost empty. Then it drafted the missing layer: service reminders, seasonal check-ins, ownership milestones and win-back messages for customers who’d lapsed. The team’s own service records set the timing and the triggers; GenAI built the structure and the words around them.
You are a customer-journey strategist for a multi-brand car dealership and service group. Map our customer journey across four stages — [your four stages, e.g. awareness → consideration → purchase → ownership & service] — from the CUSTOMER’s point of view: at each stage, what they need, what they feel, what they ask, and what we should be doing.
Then focus on the ownership & service stage and draft the communications most dealerships skip: service reminders, seasonal check-ins, ownership milestones, and a win-back for lapsed customers.
For timing and triggers, use placeholders like [INSERT FROM OUR SERVICE DATA] rather than guessing intervals. Flag every assumption you make about our customers as VERIFY WITH OUR DATA.
The caveat that decides whether this works. GenAI can map a generic automotive journey in minutes, and a generic map is exactly the trap. It doesn’t know when your customers actually lapse, why they drift to the independent garage, or which milestones matter to them; asked, it will invent plausible intervals and confident retention “statistics” that describe no one. Its value is the structure and the first draft of the words. The real journey lives in your service records and your CRM, and the timing has to come from there. GenAI maps the territory; your data draws the route.
The Result: Marketing the Quarter of the Journey that Pays
The map made the obvious finally visible: the group had been marketing to three-quarters of a journey and abandoning the quarter that pays. With the ownership and service stage filled in – reminders that arrived when a car actually needed work, check-ins that kept the relationship warm between purchases – the silence after the sale ended. Service, the dependable margin, had a marketing engine behind it for the first time, and the road back to the next sale ran through the workshop instead of through a competitor’s forecourt. No invented figures here: the change is that the most profitable part of the journey stopped being the part no one was working on.
Recommended KPIs to Follow
The service and retention stage is measured, not guessed, so the KPIs are the ones the showroom tends to overlook. These are the metrics to watch, where the industry sits, and the direction this work should push them. The point is the direction of travel, not a promised number.
Service retention rate
The share of buyers who come back to you for servicing rather than drifting to an independent. This is the metric the ignored stage exists to move, and the one most directly in your control through lifecycle communication.
Benchmark: NADA recommends 72%+, but the industry has fallen short: only ~54% of owners of newer cars returned to their selling dealer for service in 2025, down from 72% in 2023 (Cox Automotive; NADA / TradePending).
Next-Vehicle (Repurchase) Retention
Whether the customer buys their next car from you. Service is the strongest predictor: keep the service relationship and you tend to keep the customer; lose it and the next sale goes to whoever is in front of them. The retention stage is how the workshop feeds the showroom.
Benchmark: Brand retention runs around 44% nationally – more than half of owners buy their next vehicle elsewhere (Reynolds & Reynolds, 2024).
Lapsed-Customer Reactivation (win-back)
Of the customers who have drifted, how many a timed win-back brings back. The reactivation message is some of the cheapest revenue in the building, because recovering a lapsed customer costs a fraction of finding a new one.
Benchmark: No clean public figure for win-back rate – an internal metric; for context, acquiring a new customer costs roughly 6-7× more than retaining one (Bain & Company). Set your own baseline.
Service retention is the metric this work owns; repurchase and reactivation follow it. And the prize is outsized – fixed-ops service and parts deliver close to half of dealership gross profit on a fraction of the revenue. Track your own trend; the benchmarks are context, not a scoreboard.
Why this Transfers
Every business maps the part of the journey it enjoys (the chase, the close) and quietly ignores the part that pays the bills. The transferable move is to map all of it from the customer’s side, find the stage with no marketing on it, and ask why the most profitable, most recurring relationship is the one you stopped talking to.
Recommended Articles: