Marketing Metrics That Actually Matter: Choosing KPIs by Business Model
There is no universal list of good marketing metrics. A metric that is vital for a subscription business is a vanity number for a transactional one. Here is how to choose the KPIs that actually matter, by business model and funnel stage, not by convention.

Every marketing director has inherited a dashboard they did not design. It has twenty metrics on it. Some were added because a previous leader cared about them. Some came bundled with a tool. Some are there because the board asked for them once, three years ago, and nobody has removed them since. The dashboard is comprehensive, busy, and quietly useless, because it measures everything and therefore prioritises nothing.
The problem is not that the metrics are wrong. Most of them are real numbers measuring real things. The problem is that they were chosen by accumulation rather than by decision, and a metric that matters enormously for one business model can be a pure vanity number for another. Monthly active users is the heartbeat of a subscription product and an irrelevance for a business that sells one high-consideration purchase every few years. Cost per acquisition is the metric that governs a transactional e-commerce brand and a dangerously incomplete picture for a business whose value is in the second, third, and tenth purchase.
This article replaces the universal metrics list with something more useful: a way to choose the metrics that matter for your specific business model. It builds on the Metrics Cheat Sheet published earlier on the blog – which defined what each metric means – by adding the lens that determines which of them you should actually care about.
Why the Universal Metrics List Is a Trap
Search for "the marketing metrics every team should track" and you will find a hundred versions of the same list. Traffic, conversion rate, cost per lead, customer acquisition cost, return on ad spend, engagement rate, and so on. Every metric on the list is real. And the list itself is a trap, because it implies that good measurement is a matter of tracking the right universal set, when in fact good measurement is a matter of choosing the small subset that governs your business and deliberately ignoring the rest.
The universal list produces the twenty-metric dashboard. It encourages teams to track everything trackable, on the theory that more measurement is more rigorous. The opposite is true. A dashboard with twenty metrics has no priorities, and a measurement system with no priorities cannot drive a decision, because when everything is a KPI, nothing is. The rigour is not in the tracking. It is in the choosing.
The measurement principle: The value of a metric is not a property of the metric. It is a property of the relationship between the metric and the business model. The same number can be the most important figure on the dashboard for one company and noise for another. Choose metrics by asking what your business model actually runs on, and not by copying a list built for a business that is not yours.

The Business-Model Lens
The single most useful question in marketing measurement is not "what should we track?", but more likely "how does this business actually make money over time?". The answer determines which metrics matter, because it determines where the value is created, and value creation is the only thing worth measuring.
Four business-model archetypes cover most B2B and B2C companies. Each one creates value differently, and each one therefore has a different primary metric, the single number that most closely tracks whether the business is winning. The archetypes are not rigid boxes; many businesses blend them. But identifying the dominant model is what turns a generic dashboard into a decision-making instrument.
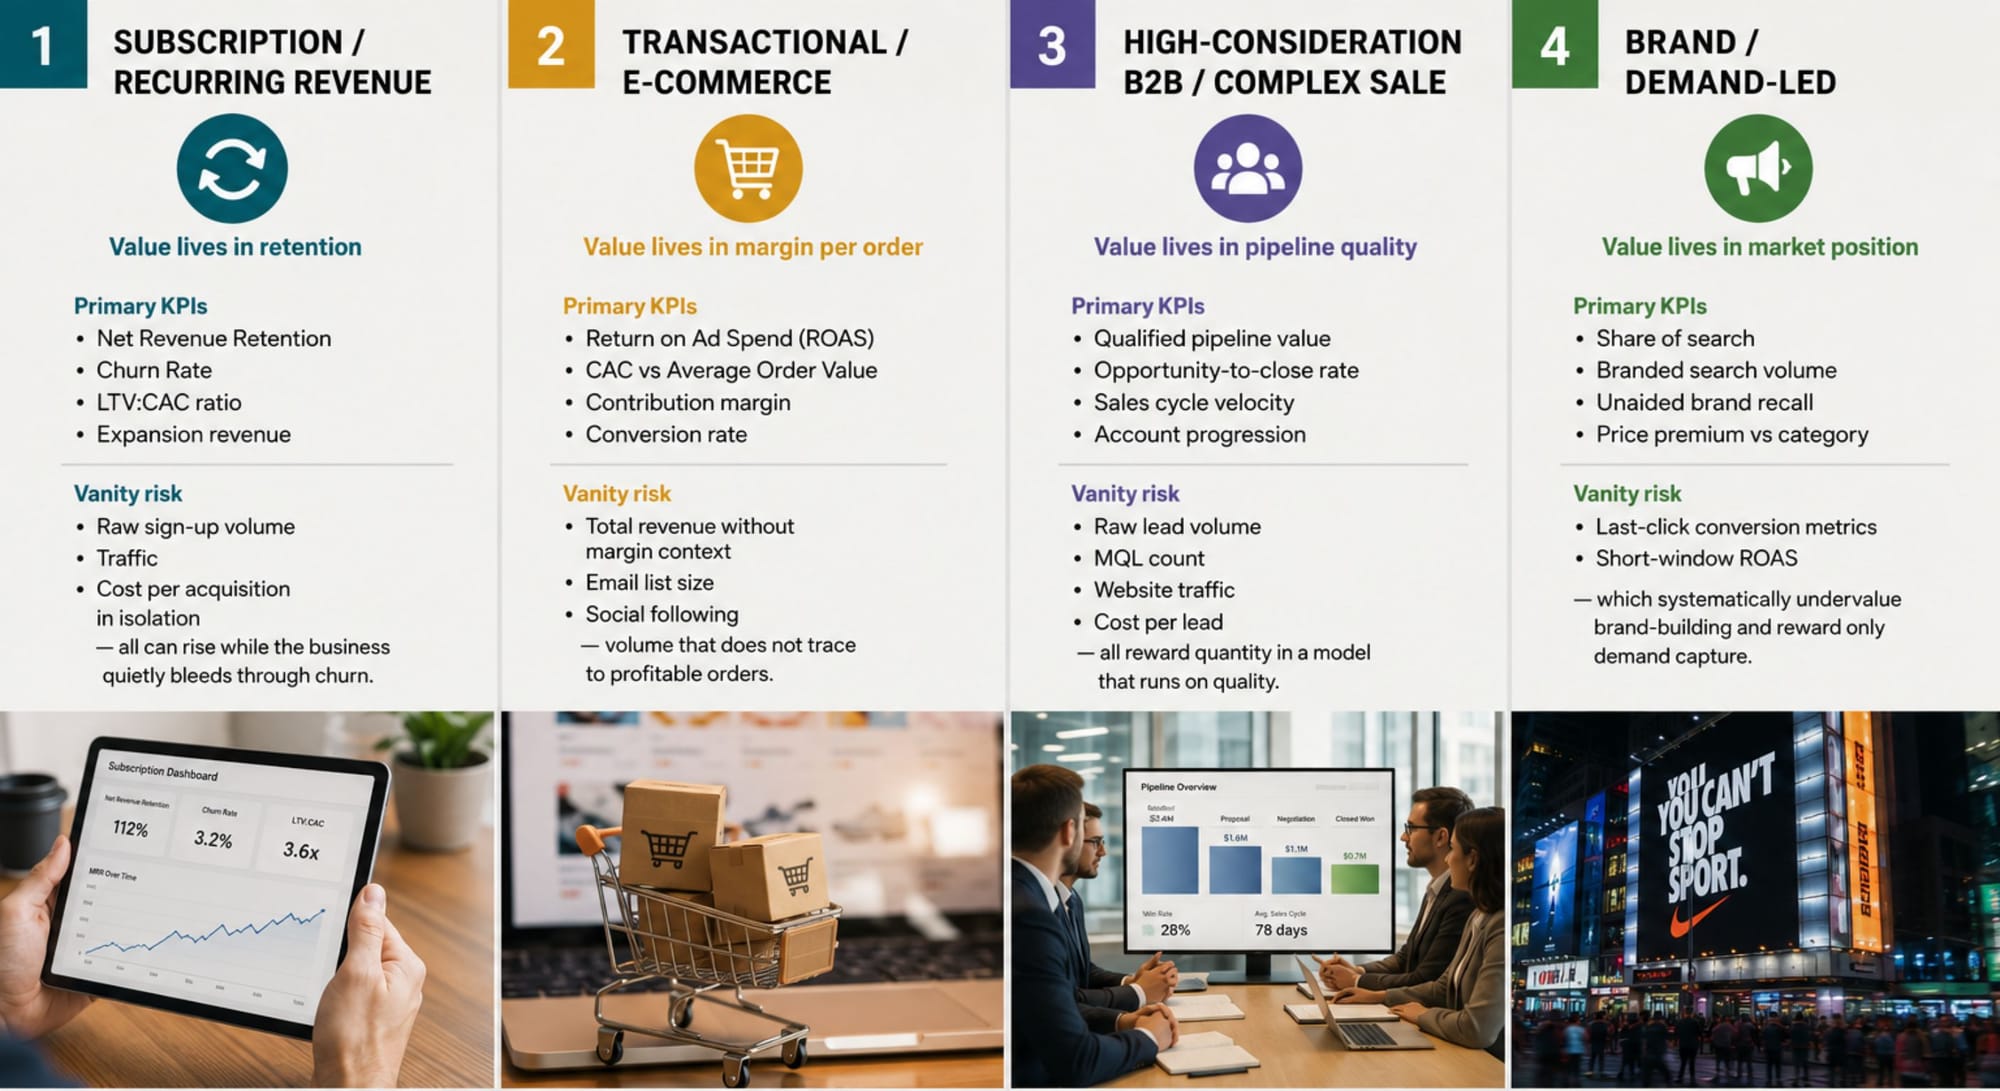
The Business-Model Lens – Four Archetypes and Their Primary Metrics
Model 1 – Subscription / Recurring Revenue Business Model
Value lives in retention
The subscription business does not make its money at the point of sale, it makes it over the lifetime of the relationship. A customer acquired and lost in three months is a loss, regardless of how cheaply they were acquired.
The primary metric is therefore a retention metric: net revenue retention, churn rate, or lifetime value relative to acquisition cost. Acquisition metrics matter only in relation to retention; a low acquisition cost that produces high-churn customers is not efficiency, it is a leak with good unit economics on the way in.
Primary KPIs: Net Revenue Retention · Churn Rate · LTV:CAC ratio · Expansion revenue
Vanity risk: Raw sign-up volume · Traffic · Cost per acquisition in isolation — all can rise while the business quietly bleeds through churn.
Model 2 – Transactional / E-commerce Business Model
Value lives in the margin per order
The transactional business makes its money at the point of sale, on the margin of each order. Repeat purchase helps, but the core engine is efficient acquisition converting to profitable transactions.
The primary metric is the relationship between what it costs to acquire a customer and what that customer spends: return on ad spend, cost per acquisition against average order value, and contribution margin. Here, acquisition efficiency genuinely is the game, which is exactly why the subscription obsession with retention can mislead a transactional team into over-investing in loyalty that the margin does not support.
Primary KPIs: Return on Ad Spend · CAC vs Average Order Value · Contribution margin · Conversion rate
Vanity risk: Total revenue without margin context · Email list size · Social following — volume that does not trace to profitable orders.
Model 3 – High-Consideration B2B / Complex Sale Business Model
Value lives in pipeline quality
The complex B2B sale is long, involves a buying committee, and closes infrequently, but at high value. Lead volume is almost meaningless here, a hundred low-fit leads are worth less than three high-fit accounts in genuine conversation.
The primary metric is pipeline quality and progression: qualified pipeline created, opportunity-to-close rate, and average deal velocity through the stages. This is the model most damaged by the universal metrics list, because the list is dominated by volume metrics, and volume is precisely the wrong lens for a business where fit matters far more than count.
Primary KPIs: Qualified pipeline value · Opportunity-to-close rate · Sales cycle velocity · Account progression
Vanity risk: Raw lead volume · MQL count · Website traffic · Cost per lead — all reward quantity in a model that runs on quality.
Model 4 – Brand / Demand-Led Business Model
Value lives in market position
Some businesses – often established consumer brands, sometimes category-defining B2B companies – create value primarily through market position: the preference, recognition, and pricing power that come from being the brand the market thinks of first.
The primary metric is a brand and demand metric: share of search, unaided brand recall, branded search volume, and the price premium the brand commands. These are the hardest metrics to measure and the easiest to neglect, which is why demand-led businesses so often over-report on the performance metrics that are easy to track and under-invest in the brand position that actually drives their economics.
Primary KPIs: Share of search · Branded search volume · Unaided brand recall · Price premium vs category
Vanity risk: Last-click conversion metrics · Short-window ROAS – which systematically undervalue brand-building and reward only demand capture.
The diagnostic that cuts through: For any metric on your dashboard, ask one question: "if this number doubled, would the business be meaningfully better off?".
For a subscription business, doubling sign-ups while churn holds does little; doubling retention transforms it. For a complex B2B sale, doubling lead volume may change nothing; doubling opportunity-to-close rate changes everything. The metrics that pass this test are your KPIs. The rest are context at best, distraction at worst.
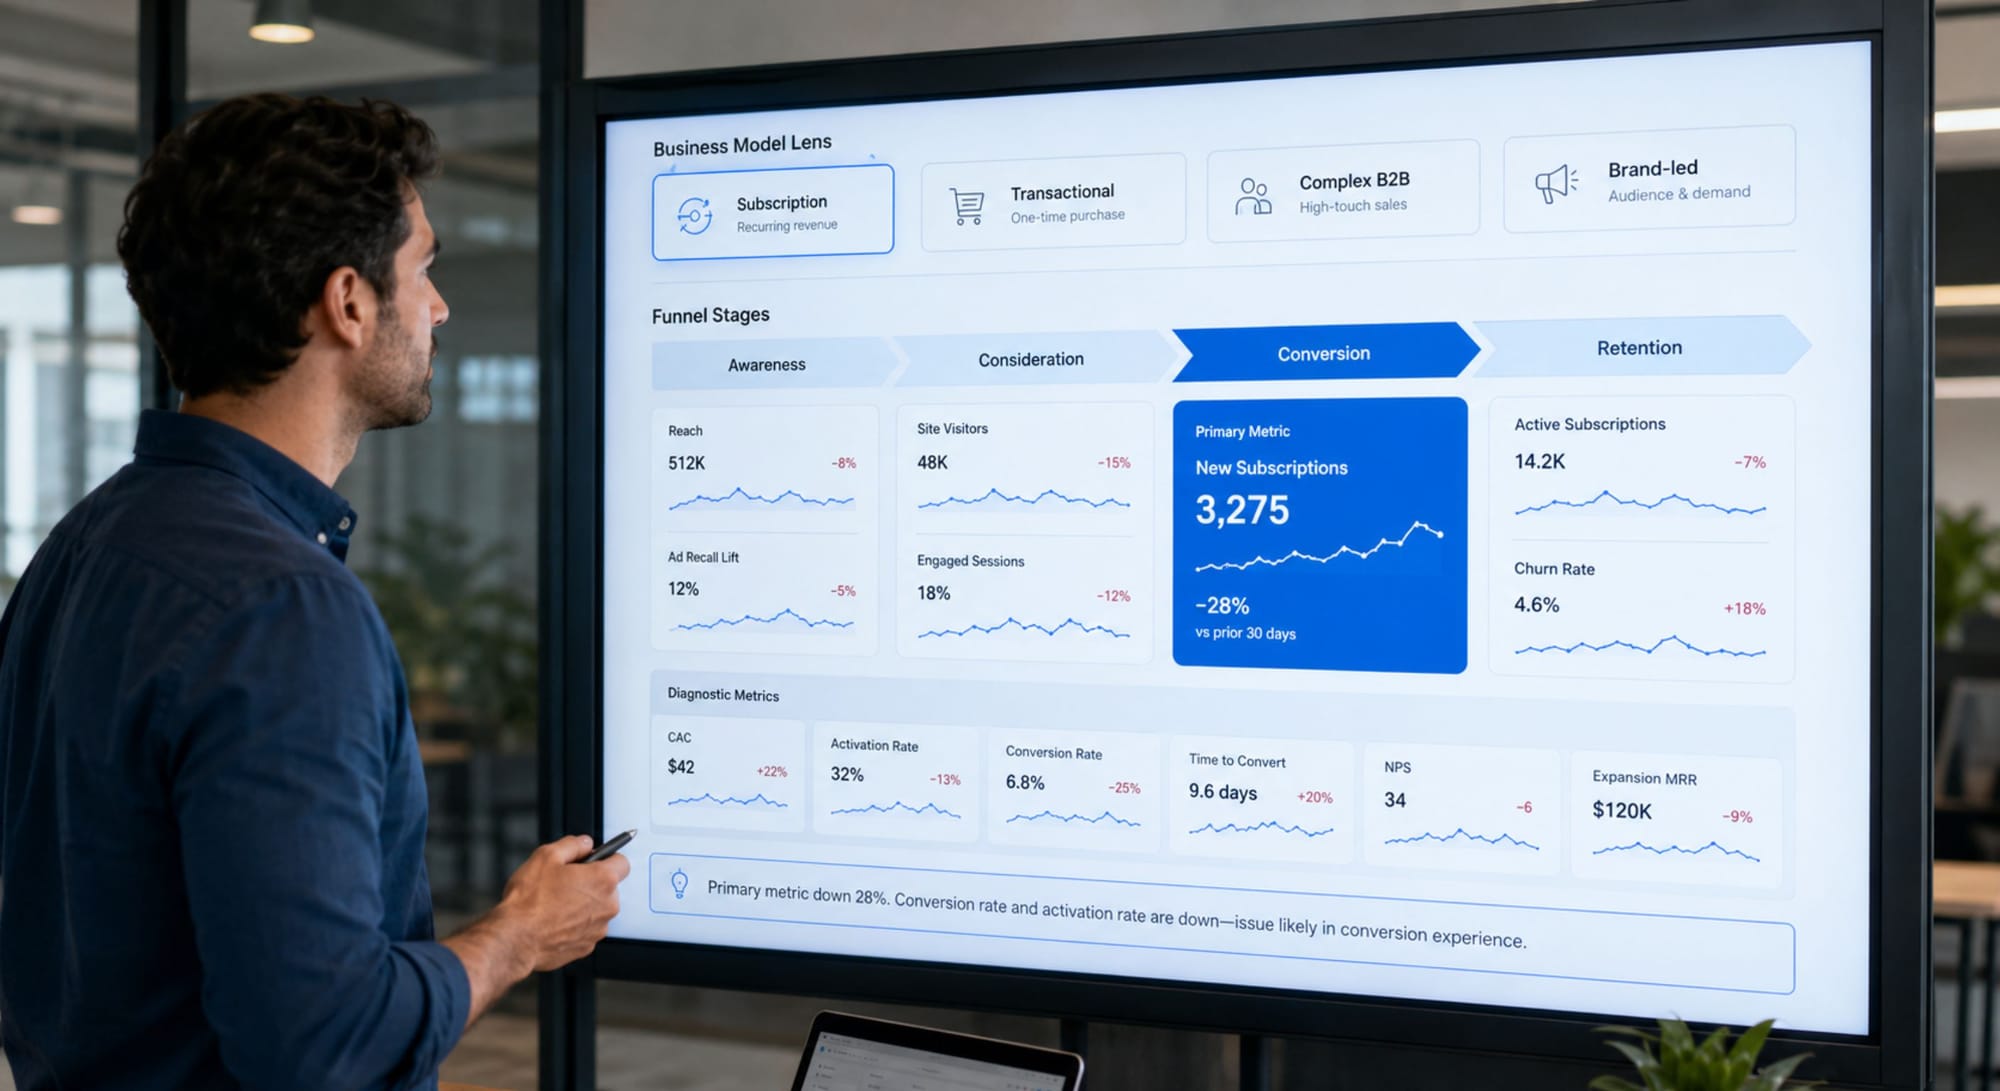
Layering the Funnel Stage on Top of the Model
The business model determines the primary metric. The funnel stage determines the diagnostic metrics beneath it. Together they turn a single headline number into a system that can locate a problem, not just observe one.
Every business model still has a funnel, the Hero's Journey funnel described earlier on the blog applies regardless of model. What changes by model is which stage carries the primary metric. For a transactional business, the primary metric sits at conversion. For a subscription business, it sits at retention, past the point most funnels stop looking. For a complex B2B sale, it sits in the long consideration-to-opportunity progression. The funnel stages that are not carrying the primary metric are not ignored, they become the diagnostic layer, the metrics you read when the primary number moves and you need to know why.
This is what separates a measurement system from a dashboard. A dashboard shows you that the primary metric fell. A measurement system, with stage-level diagnostics beneath a model-appropriate primary metric, shows you which stage it fell at — which is the difference between knowing you have a problem and knowing where to fix it.
Three Mistakes That Produce Busy, Useless Dashboards
Mistake #1: Importing another business model's primary metric
The most consequential measurement error is borrowing the primary metric of a business model that is not yours, usually because it is the metric the industry talks about most. A high-consideration B2B team fixates on lead volume because the demand-gen conversation is dominated by it, and optimises for a number that its own business model treats as noise. A subscription business celebrates acquisition cost while churn quietly erodes the base. The fix is to identify your dominant business model first, then choose the primary metric that model runs on, even when it is not the metric your peers are discussing.
Mistake #2: Measuring everything to avoid choosing
The twenty-metric dashboard is not a sign of rigour. It is a sign of an unmade decision. Tracking everything feels responsible and defers the harder work of deciding what actually matters. But a measurement system that refuses to prioritise cannot drive a decision, because it offers no hierarchy; every metric appears equally important, which means none is. The discipline is subtraction: identify the one primary metric and the handful of diagnostics beneath it, and move everything else to a secondary view that is consulted, not monitored.
Mistake #3: Choosing metrics by what is easy to measure
Last-click attribution, short-window ROAS, and raw traffic share one seductive quality: they are easy to measure cleanly. Brand position, pipeline quality, and lifetime value share the opposite quality: they are hard to measure and easy to argue about. Teams drift toward the easy metrics not because they matter more, but because they resolve more cleanly, and in doing so, they systematically under-measure the things that actually drive their business model. The fix is to accept that the most important metric for your model may be the hardest one to measure, and to measure it imperfectly rather than measure the wrong thing precisely.
How to Use GenAI as Your Metrics Selector
Choosing the right KPIs is a structured reasoning task; mapping a business model to the metrics that govern it, and flagging the vanity metrics that model is prone to over-value. GenAI is well-suited to running that mapping as a first pass, provided you supply the business reality it cannot know.
Use the following prompt:
I will describe a business. Your task is to recommend the primary KPI and the diagnostic KPIs that actually matter for THIS business model, and to flag the vanity metrics it is most likely to over-value.
THE BUSINESS:
- What we sell and to whom: [Describe]
- How we make money over time (one purchase? recurring? high-value infrequent? brand-led?): [Describe]
- Typical customer relationship length and repeat behaviour: [Describe]
- Current metrics on our dashboard: [List them]
RUN THIS ANALYSIS:
1. DOMINANT BUSINESS MODEL: Identify which archetype best fits: Subscription/Recurring, Transactional/E-commerce, High-Consideration B2B, or Brand/Demand-Led. If it blends models, name the dominant one and explain.
2. THE PRIMARY METRIC: Name the single metric that most closely tracks whether this business is winning. Justify it against the business model, not against convention.
3. THE DIAGNOSTIC LAYER: Name 3-5 stage-level metrics that would explain a movement in the primary metric, the numbers to read when the headline moves.
4. THE VANITY FLAGS: Look at the current dashboard. Identify which metrics are vanity metrics FOR THIS MODEL (real numbers that do not govern this business) and explain why each is a distraction here even if it matters elsewhere.
5. THE DOUBLING TEST: For the top 3 current metrics, answer: "if this doubled, would the business be meaningfully better off?". Use the answer to confirm or challenge its place on the dashboard.
Rules:
- Recommend by business model, never by generic best practice.
- A metric being real is not the same as a metric mattering. Judge relevance to THIS model.
- If the business genuinely blends models, say so and prioritise rather than hedging.
Validate the output against what you know about your business that the description could not capture, the strategic priorities this year, the stage of the company, the board's actual expectations. GenAI maps the model to the metrics, which is genuinely useful for cutting a bloated dashboard down to what matters. But whether retention or acquisition is the priority this specific quarter is a strategic judgment that depends on context no prompt contains. Use the analysis to challenge the dashboard. Make the final call yourself.
Final Thought
The busiest dashboards are usually the least useful, because they were built by accumulation rather than by decision. Every metric on them is real. Almost none of them was chosen by asking the only question that matters: what does this specific business actually run on? A metric earns its place on the dashboard not by being trackable, and not by being popular in the industry, but by governing the economics of your particular model.
Measurement is not the discipline of tracking more. It is the discipline of choosing what to track and having the confidence to ignore the rest. Identify your business model. Name the one metric it runs on. Build the diagnostic layer beneath it. And move everything else off the dashboard and into the archive, where noise belongs.
Is your dashboard measuring what your business actually runs on or everything you happen to be able to track?
Recommended Use Cases:
 Diana Socaciu